

Case study
The Burrow, Bengaluru.
A room that chose to improve their sound.
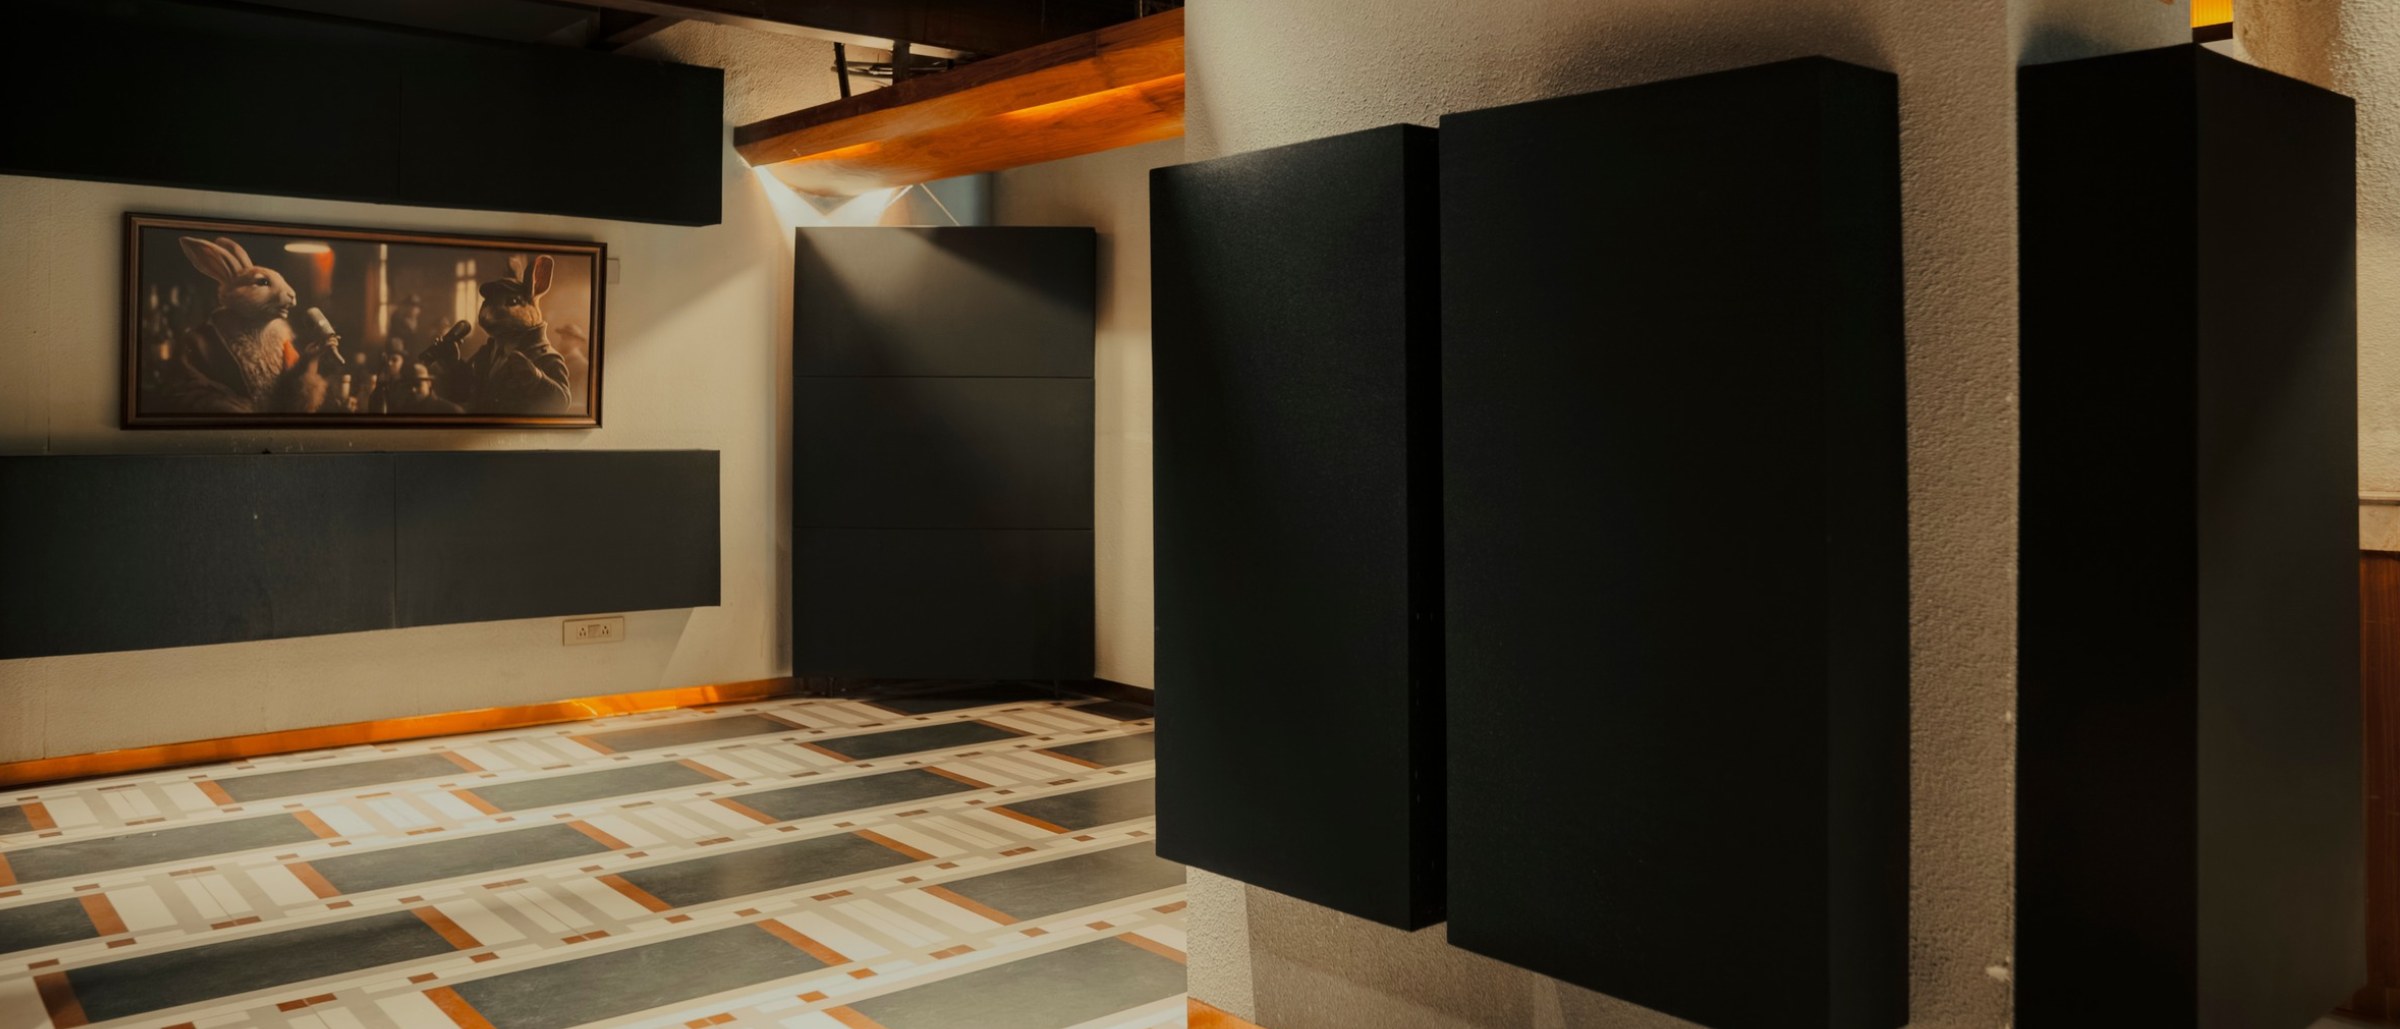
The room
The Burrow is a nightclub in Bengaluru. Like most spaces, its surfaces are hard: tile, plaster, glass and exposed timber, all under a low metal ceiling.
Three problems were audible before anything was measured.
Low-end buildup
Bass and kick were unclear rather than tight.
Harsh reflections
Sound bounced off bare surfaces and came back sounding uncomfortable.
Unclear audio
Music and speech smeared together and lost detail.
Our approach
One panel type, working the full range.
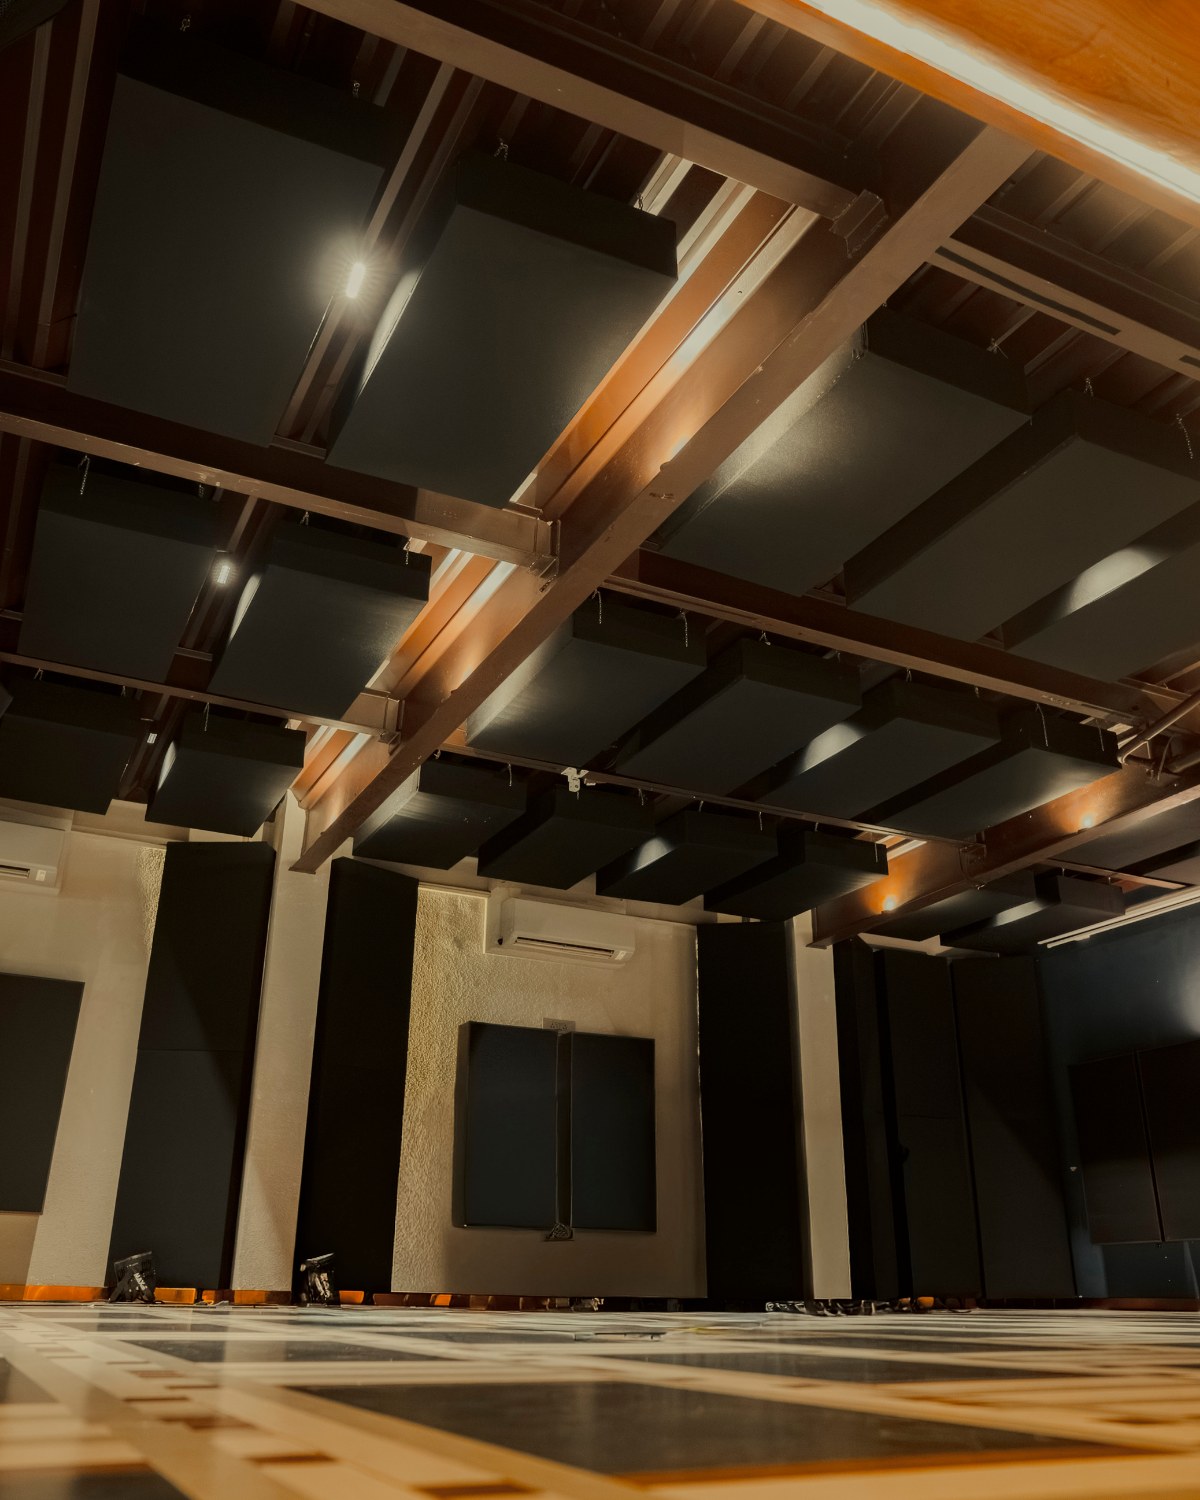
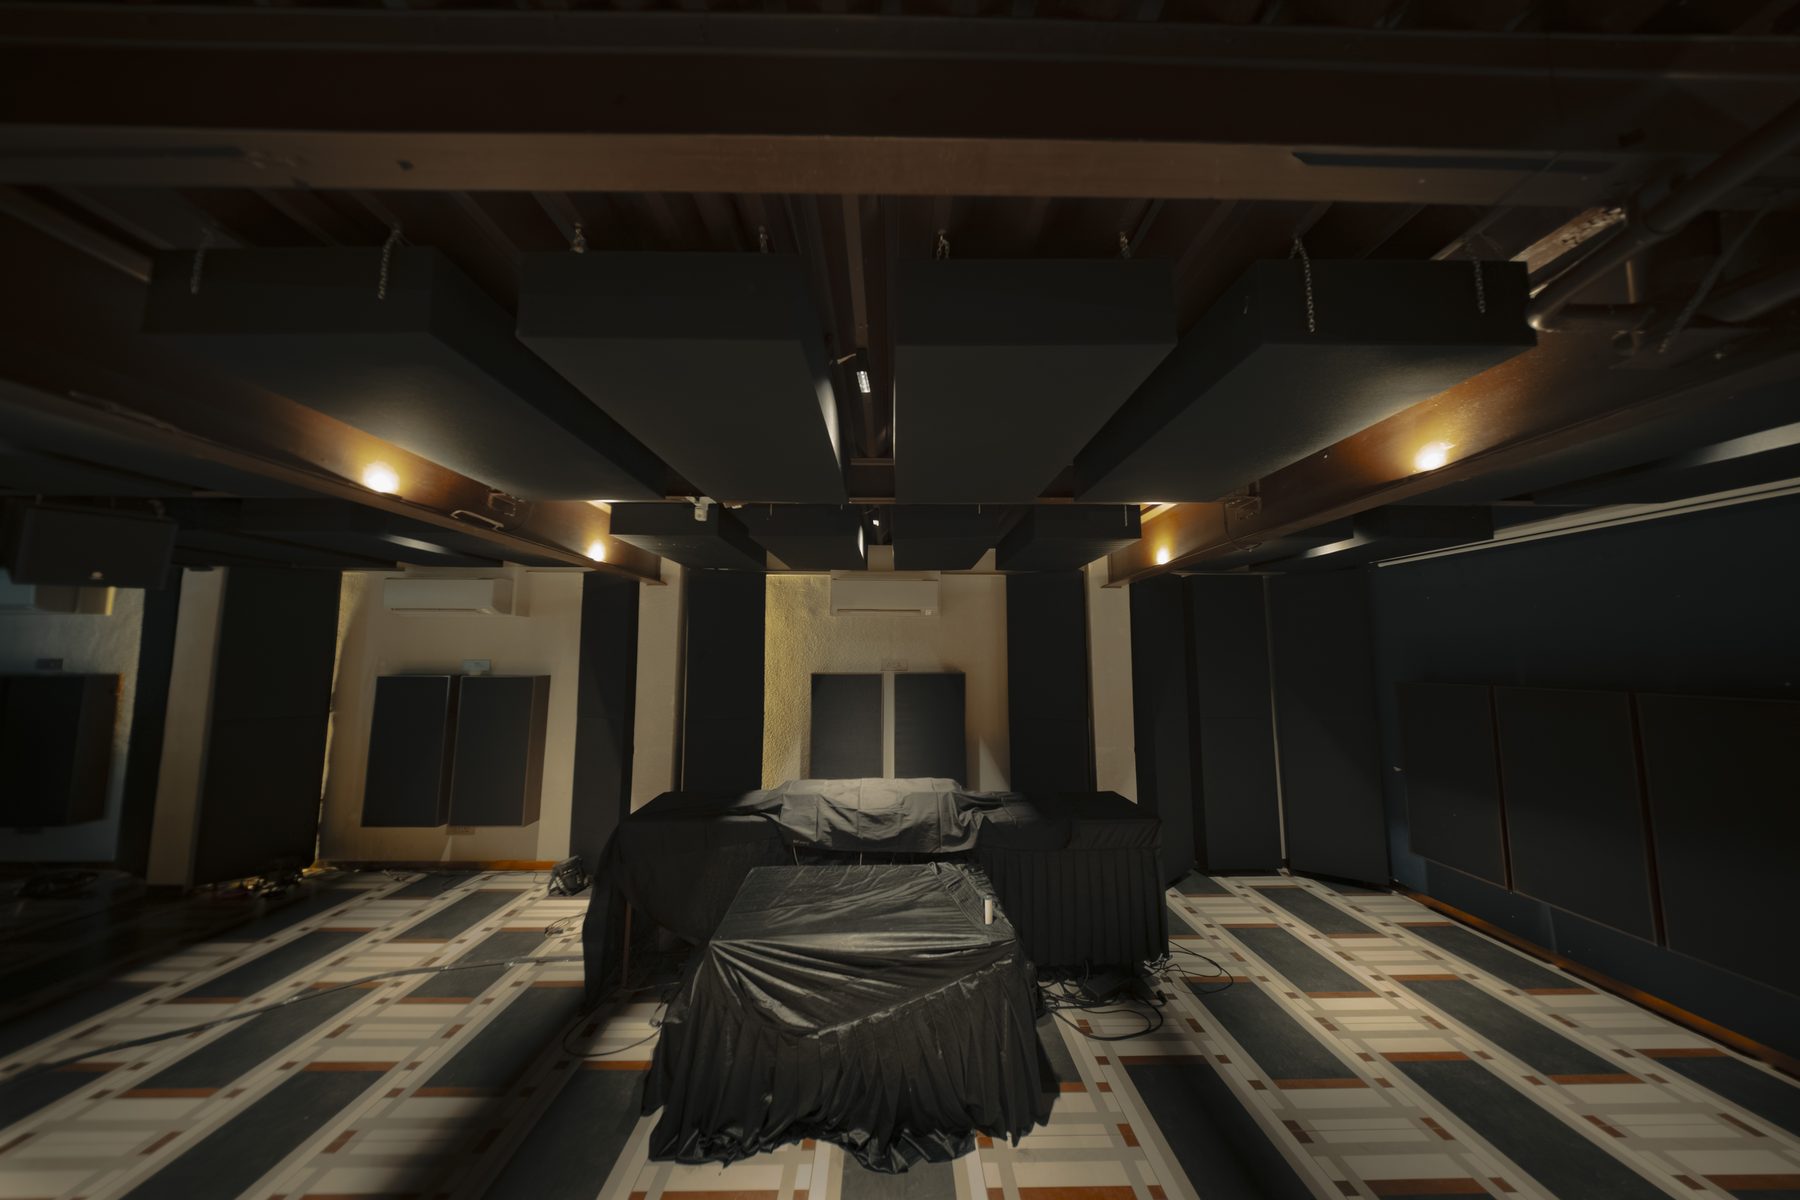
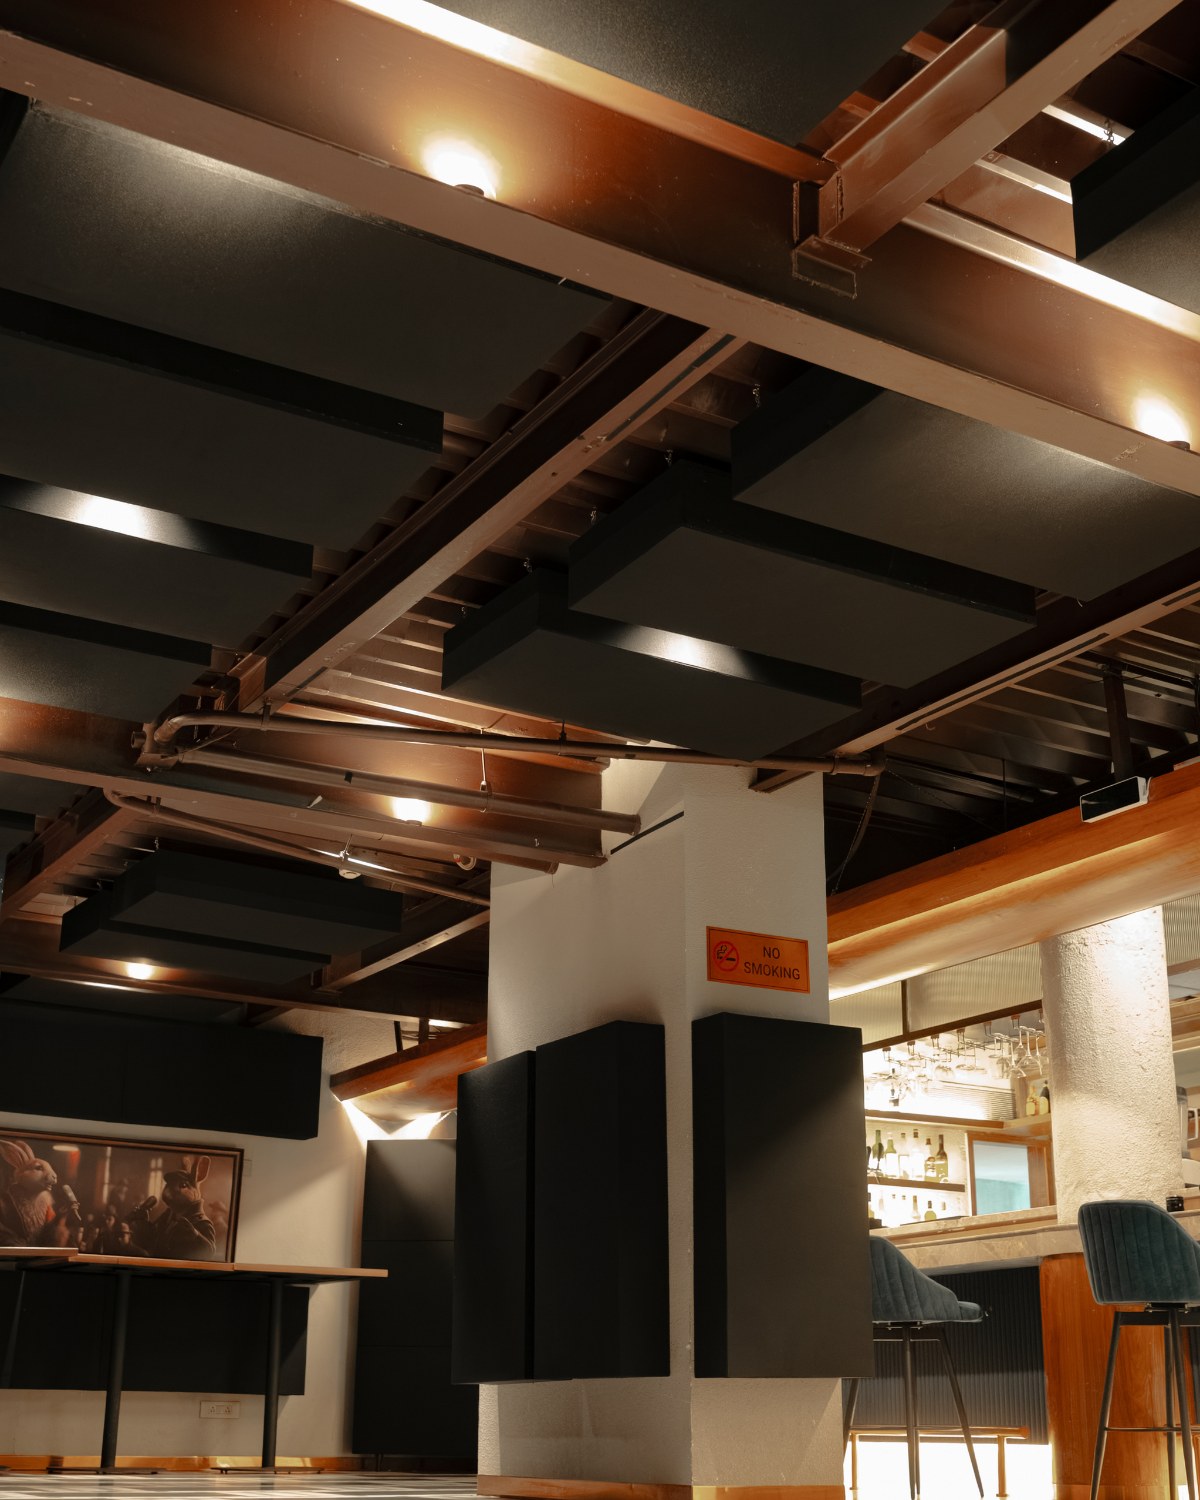
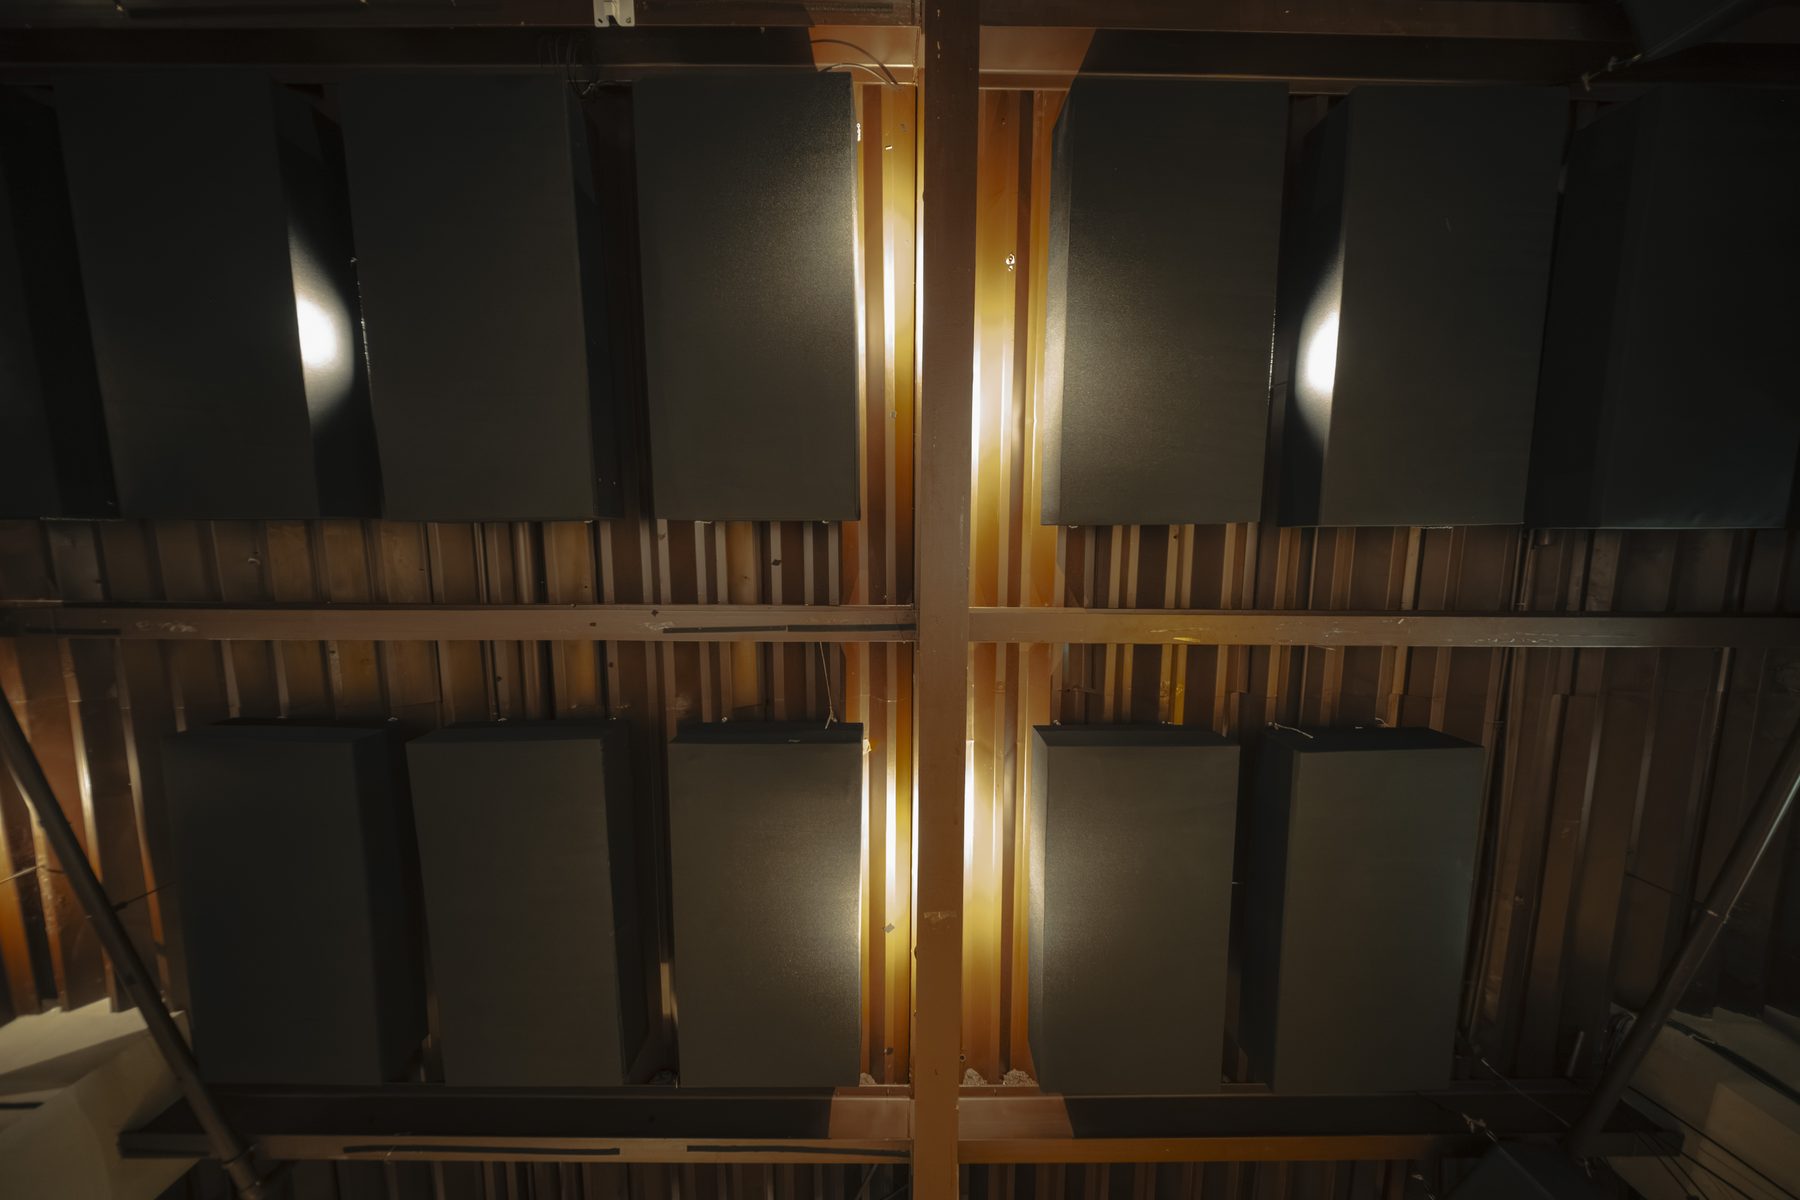
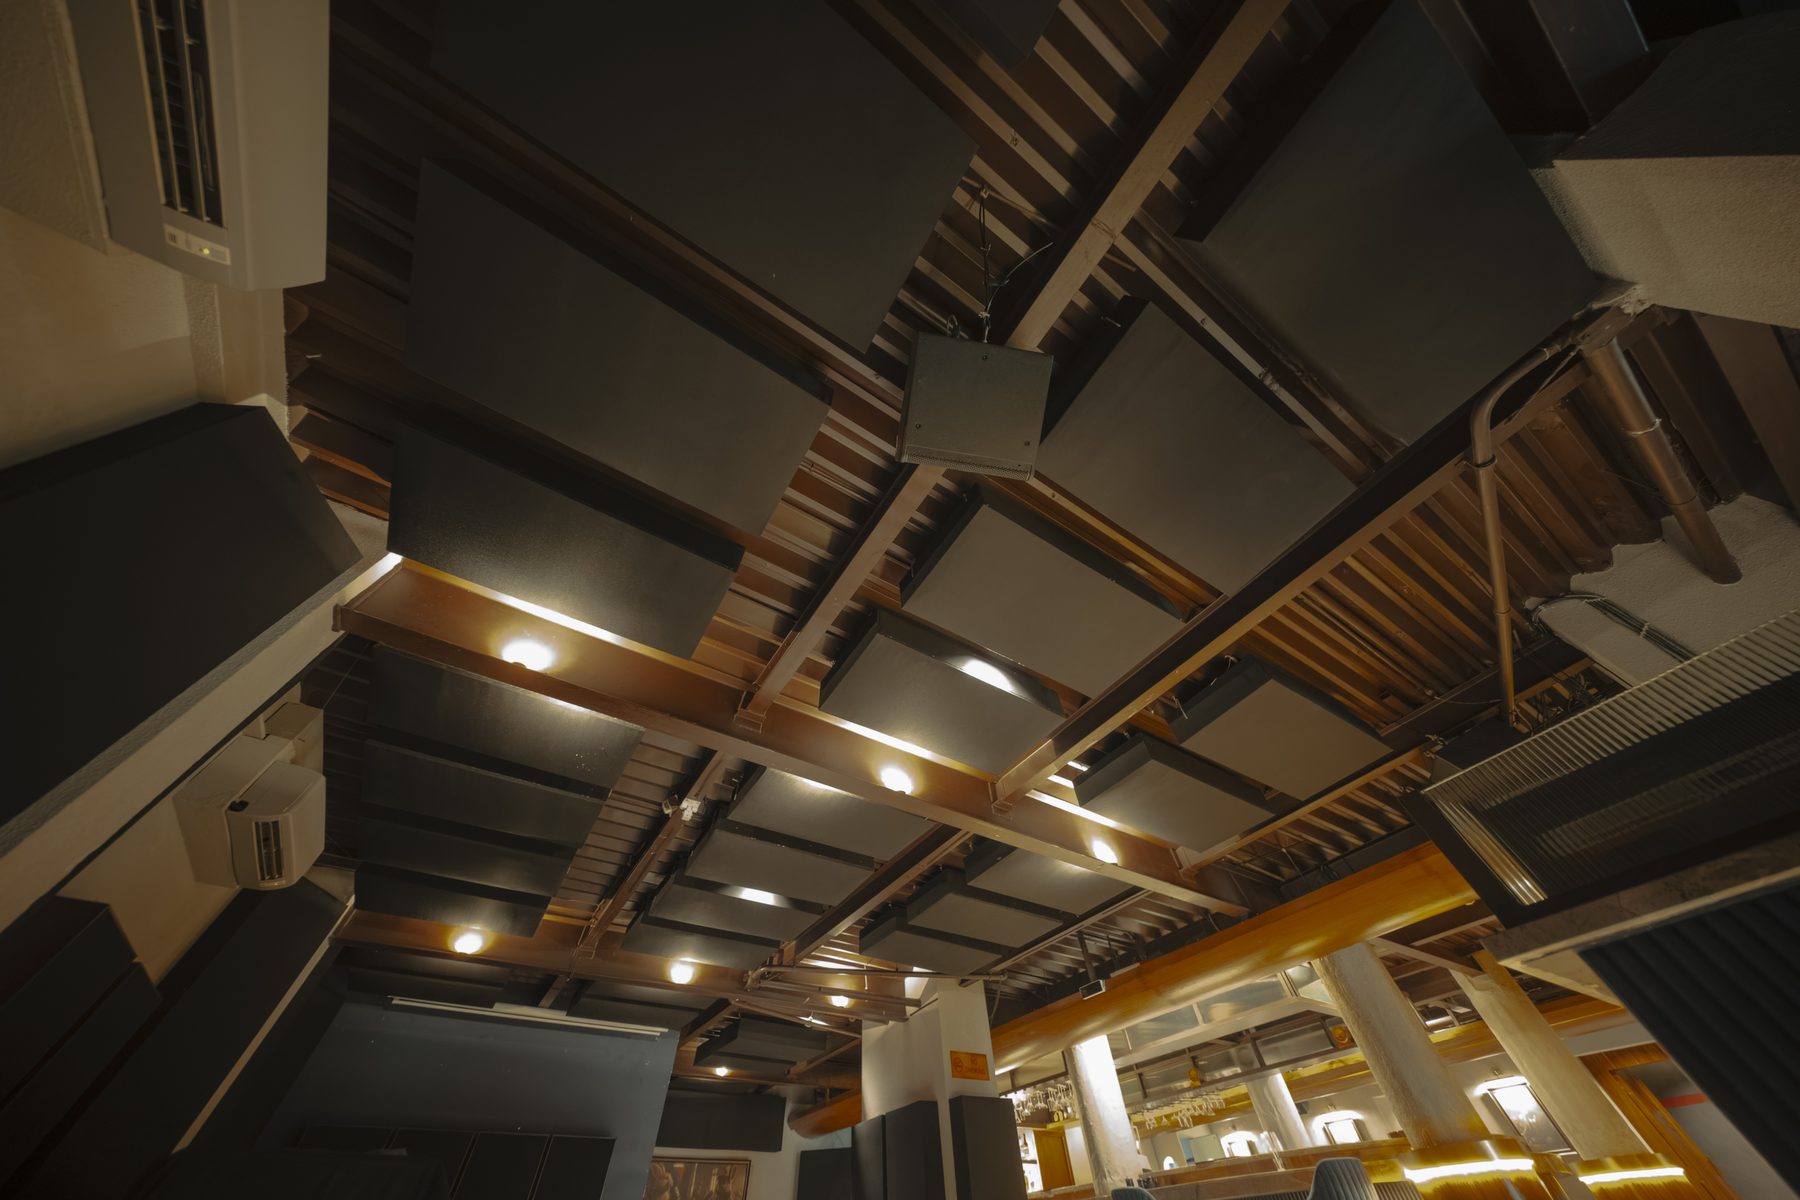
We placed 77 TRU Sink broadband absorbers across the room, sized deep enough to reach into the low end.
Treatment zones
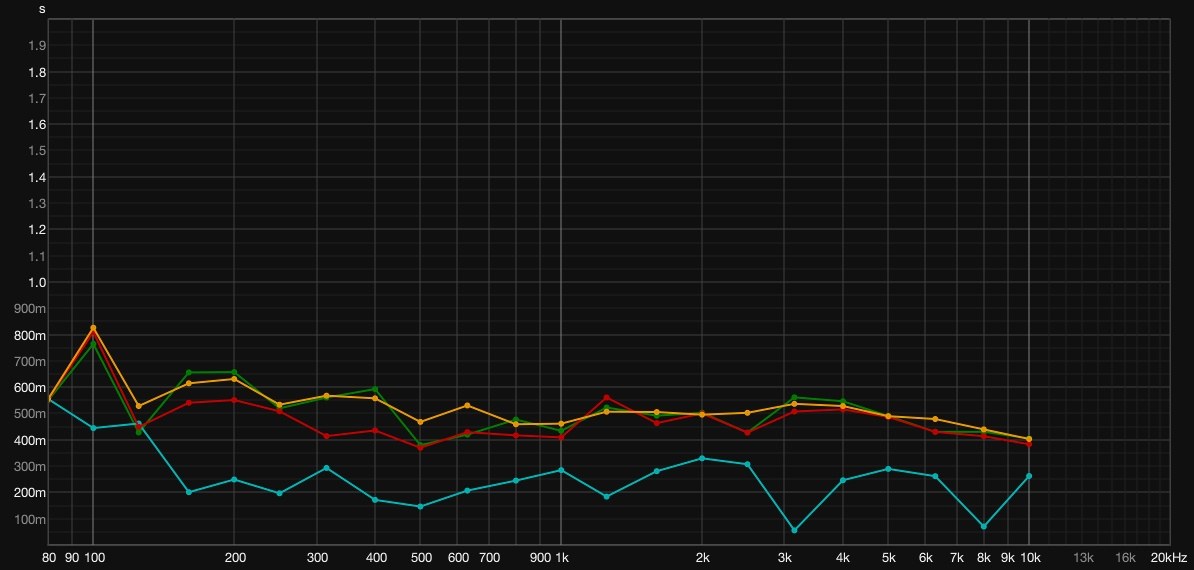
Reverberation time.
How long sound stayed in the room, by frequency. Lower is faster, and the reduction holds right across the band.
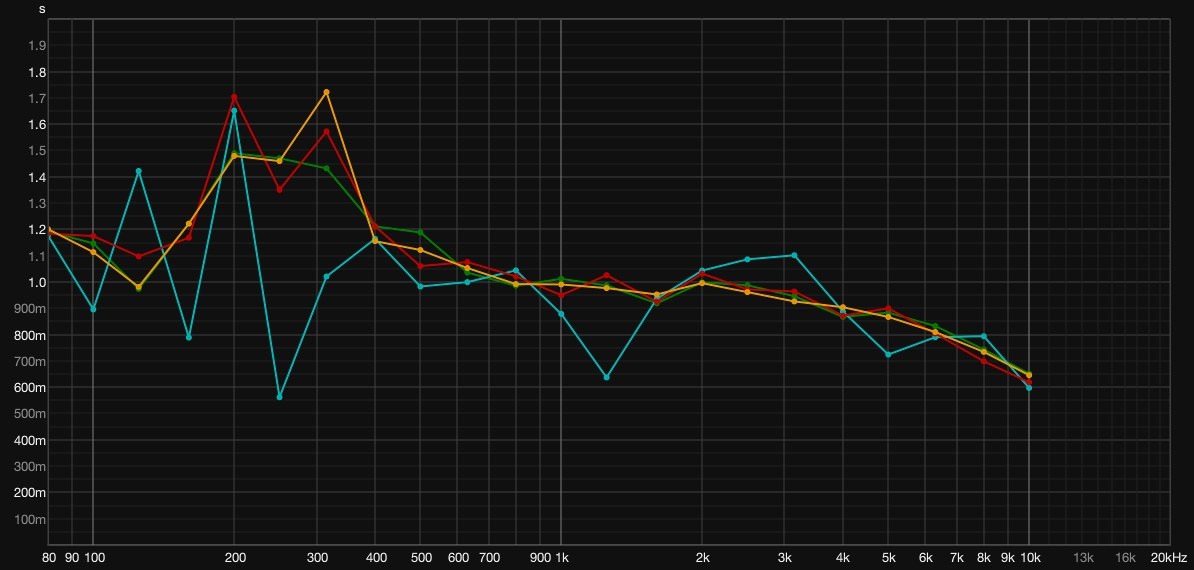
Before, decay peaked at about 1.6 s between 200 and 315 Hz, right under the body of a kick drum and the fundamental of most speech.
After, that peak is gone and the whole curve sits near 0.5 s. The single higher point at 100 Hz is the limit of the depth the room could give.
| Band | Before | After | Reduction |
|---|---|---|---|
| 80 to 160 Hz | 1.15 s | 0.63 s | 45% |
| 200 to 315 Hz | 1.60 s | 0.60 s | 63% |
| 400 to 800 Hz | 1.08 s | 0.50 s | 54% |
| 1 to 2 kHz | 1.00 s | 0.47 s | 53% |
| 80 Hz to 10 kHz | 1.15 s | 0.52 s | 55% |
Reported as T30, band averages. Measured in the room before and after treatment.
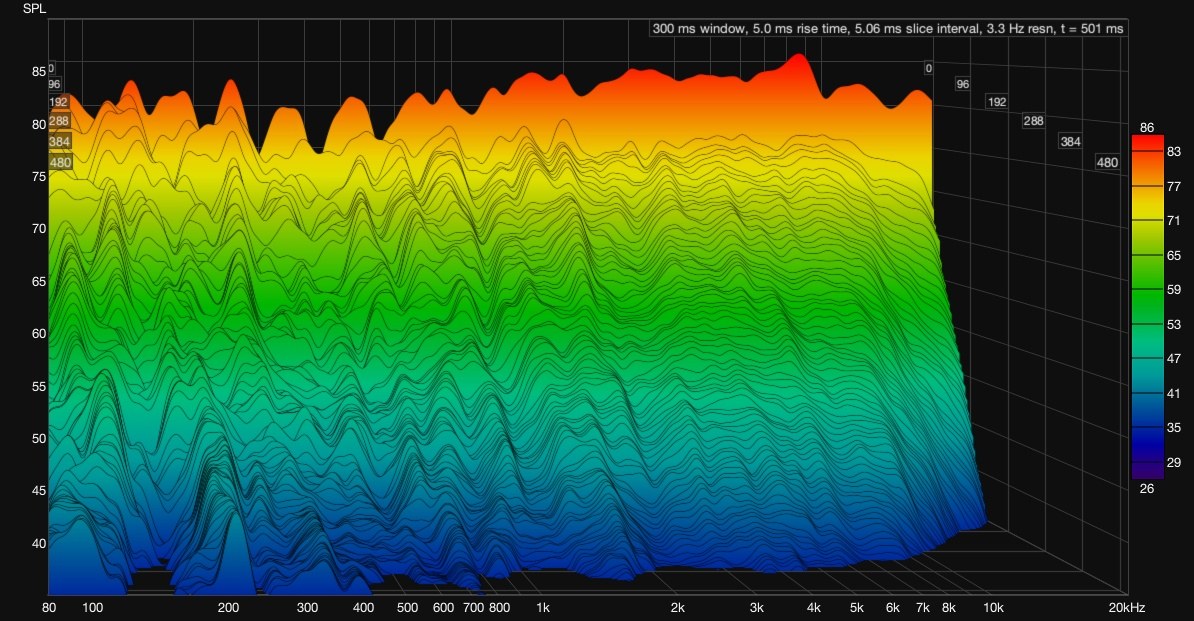
Decay across the spectrum.
How fast each frequency cleared the room. Shorter tails are better.
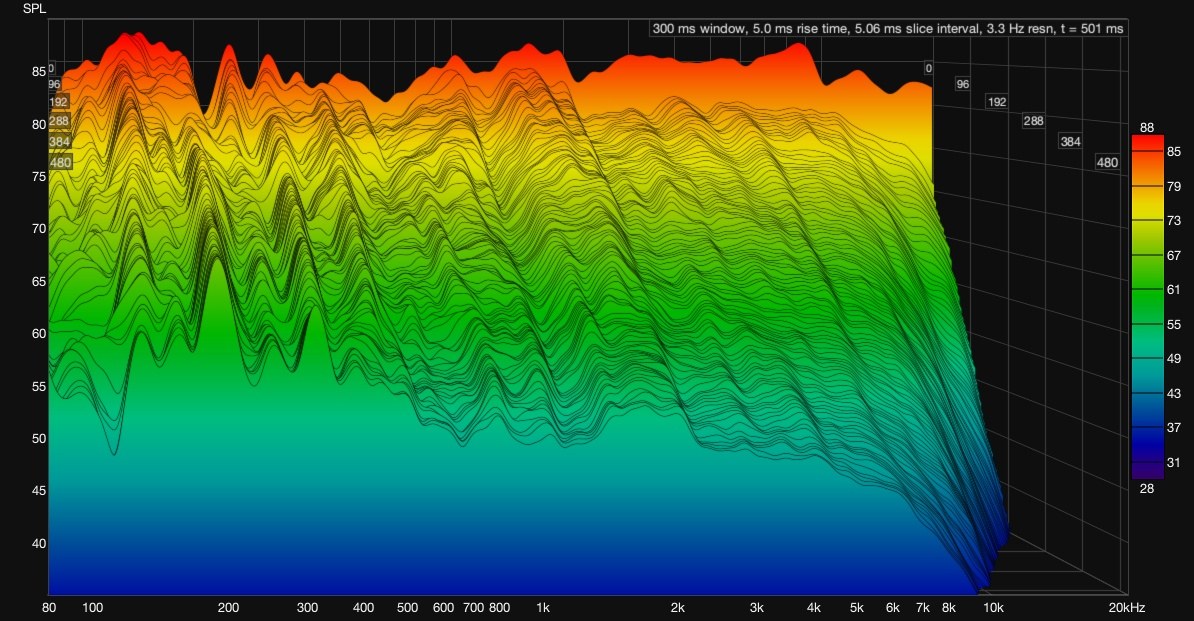
Before, low and low-mid energy between 100 and 500 Hz tails back through the full window.
After, the same region clears far sooner and the ridges flatten across the full range.
Clarity.
How much of what you hear arrives first, before the room adds its own reverberation. Higher is clearer.
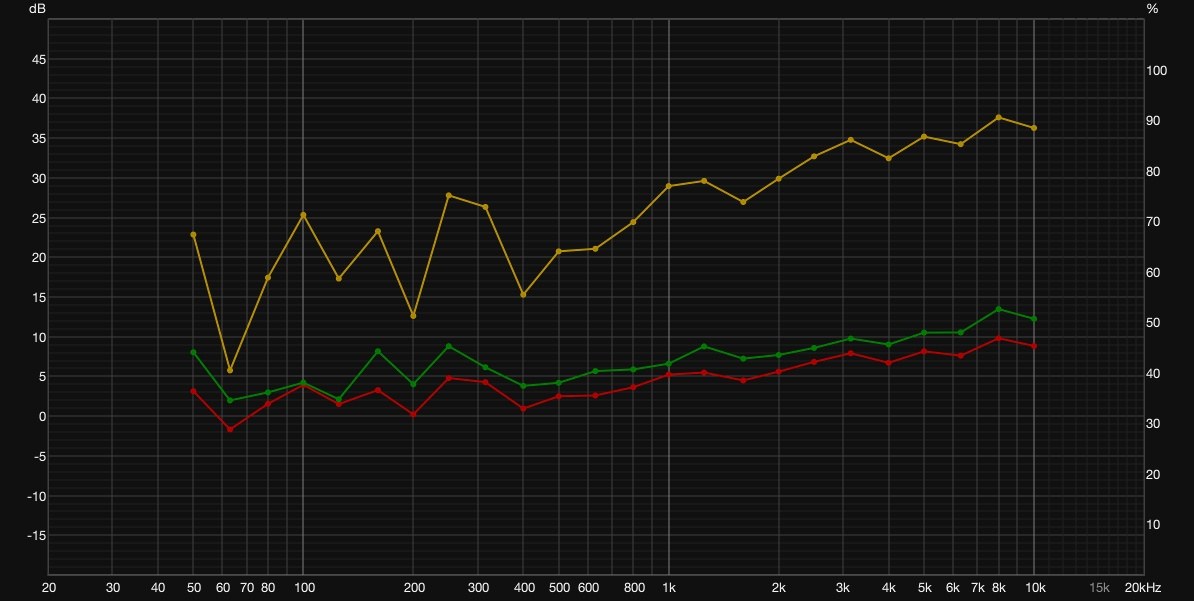
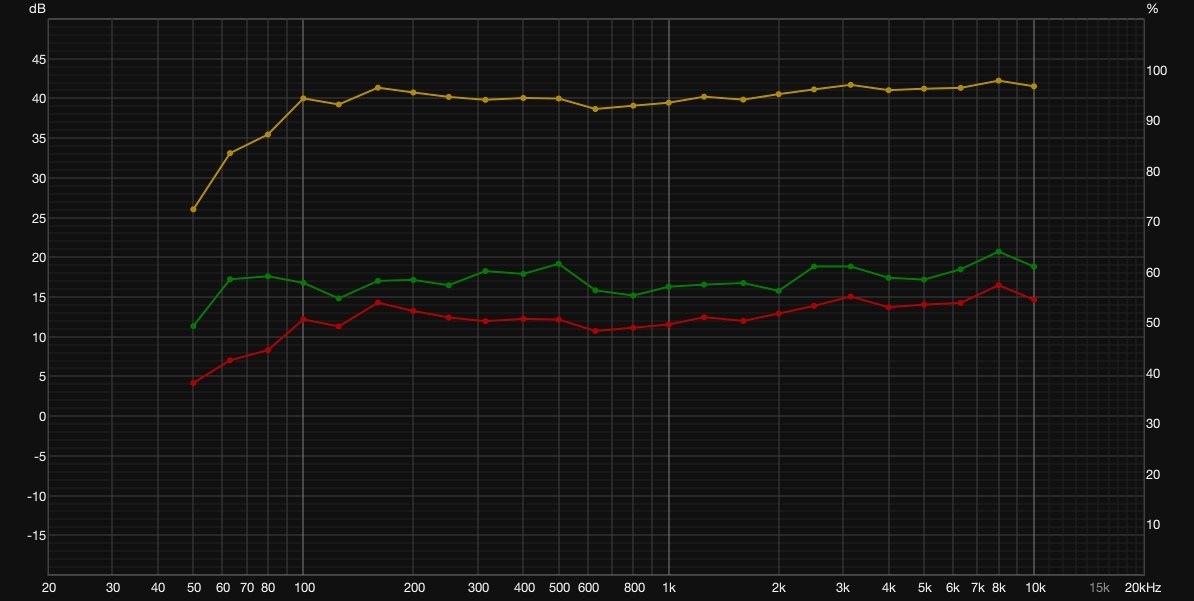
C50 is weighted for speech, C80 for music. Both climb by about 10 dB and, as important, flatten out. Even clarity across the range is what stops a room being tiring.
| Measure | Before | After | Change |
|---|---|---|---|
| C50, speech | +4 to +9 dB | +16 to +19 dB | +10 dB |
| C80, music | +2 to +7 dB | +12 to +16 dB | +9 dB |
| Clarity | 78% | 96% | +18 pts |
Get in touch.
Tell us what the purpose of the space is and what is not working about it.We will give you an honest read on what the room is doing and what it would take to change it.